Data
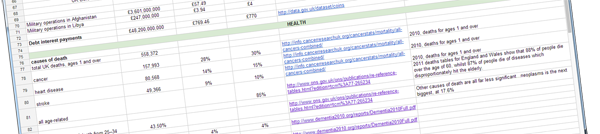
We’ve made the data used for the Scienceogram available in a Google Spreadsheet, so you can check our working, use the raw figures to make your own comparisons, or indeed do whatever you’d like with them. We’ve sourced most of the data for the Scienceogram from a range of publicly-available sources online, and the links are included in the spreadsheet. However, on occasion some of our information has been obtained by private correspondence or has needed more complex processing than a Google Spreadsheet can provide, and we’ve made a note of that too.
Please do get in touch if you have any better sources of data than those we’ve used, if you’ve spotted any mistakes, or if you’ve got any other interesting thoughts about the Scienceogram. We’d love to hear from you!