Global private and public R&D funding
How much do we really spend on research and development, and how does it vary internationally? To provide some context for The Conversation’s science funding debate (Science is vital, just not in the way you think vs Trust the markets to fund science), we broke down spending across the G20 countries.
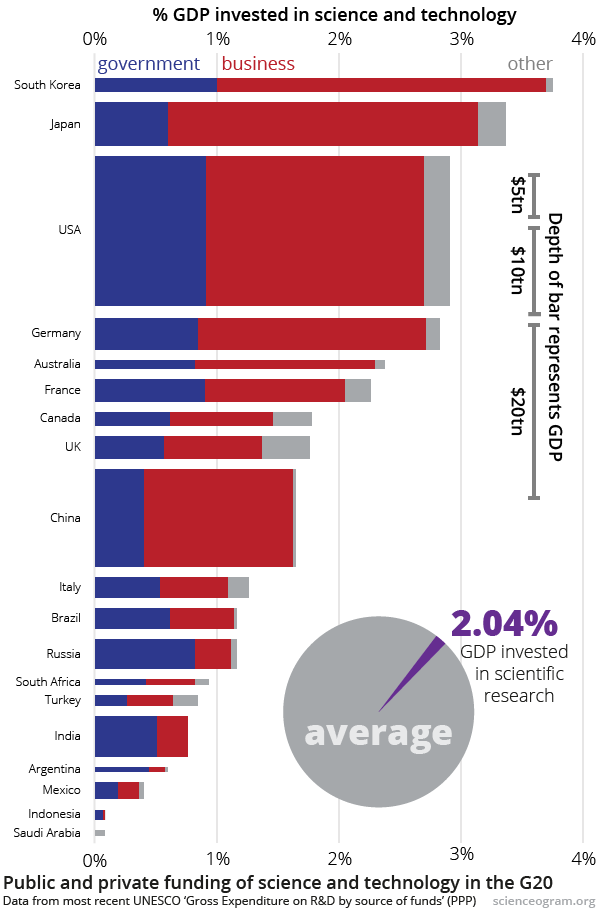
In the chart below, the vertical depth of the bars represents the countries’ GDP, a measure of total national economic output. The width of the bars represents the percentage of that GDP invested in research and development (R&D). That means that the area of each block is proportional to the overall spend on research.
The graph is divided into spending by governments, private businesses and other sources. The averages for these countries are 0.65% of GDP spent by governments, 1.26% of GDP invested by the private sector, and a further 0.13% of GDP coming from other sources.
A few broad conclusions emerge from the data:
- The percentage of GDP invested in research and development varies widely across the world. South Korea is powering ahead at 3.7% of GDP. (And its investment is increasing rapidly, up from 2.8% in 2005.) The UK is below average by most international measures, spending 1.7% of GDP on research. Spending is much lower in the less wealthy G20 member states, although time series data show that many are ramping up investment.
- The private sector forms a large part of the research ecosystem: with the exception of Brazil, Russia, India, Argentina and Indonesia—which make up 18.6% of the GDP on display here—the private sector makes the biggest contribution to national research budgets.
- The US is a global research behemoth, in both the public and private sectors. A healthy percentage of its GDP is sunk into science meaning that, in absolute terms at least, even China won’t be competing with it any time soon.
Dividing research spending into public and private inevitably misses some subtleties. There is a symbiotic relationship between state and business investment in R&D. This ranges from the direct, such as government-sponsored loans and grants for a variety of private projects, to the diffuse, like the education and training provided by public-funded research that underpins a skilled workforce.
The international variation in science policy means that it’s worth taking the sharp dividing lines on the graph with a pinch of salt: no taxonomy of research funding could adequately capture all this detail. Still, these numbers do give an impression of the big picture, and show the widely divergent levels of investment in science internationally.