Open letter on the GIST public spending tool
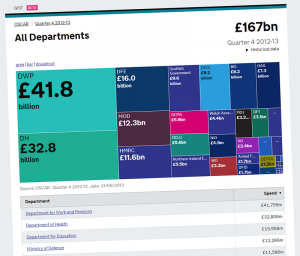
Last week, the Cabinet Office launched GIST, a new tool for displaying government spending. The website, currently in public beta, takes vast spreadsheets of public spending data and presents them as interactive infographics.
Reactions have been ambivalent, generally applauding the intention of throwing open the labyrinthine government accounts for analysis, but stopping short of declaring Mission Accomplished. Understanding GIST still requires a mastery of civil service acronyms (even at the very outset, you’re asked to choose between the QDS and OSCAR accounting systems), and there are billions of pounds labelled with everything from ‘NPISH’ to ‘n/a’.
While there have been many complaints about unhelpful categories, and many hopes (or doubts) expressed that the tool will help citizens hunt down government waste, we think there are more strategic issues to tackle. Since the Cabinet Office is currently seeking feedback, we have sent an open e-mail with some suggestions based on our experiences with the Scienceogram.
We wish the development team luck with ironing out the bugs and rolling out new features, and we hope that our suggestions will be considered.
Our message is copied below.
Dear Sir/Madam,
At Scienceogram UK we are strong believers in the importance of open data, and were excited to learn of the beta launch of GIST last week. The creation of this tool is a clear recognition by the government that transparency isn’t simply about providing data, but about doing so in an easily understood format. However, whilst GIST is clearly a step in this direction, we are concerned that there are fundamental issues which need addressing before it can be considered fit for purpose.
Our website, scienceogram.org, aims to raise awareness of the amount that we spend on scientific research, and pit that against the size of the problems that science is trying to solve. For example, cancer kills about 30% of people, and yet we spend just £4.30 per person per year on public-funded cancer research.
This kind of statistic illustrates a few ways in which we think GIST’s presentation of spending data can be made more effective.
Providing context for spending figures
Government spending figures need to be put into context in order to be meaningful. For example, this page suggests that HMRC costs £1bn per quarter. Is this a lot or a little? In order to try to ascertain this, it might be valuable to compare it to tax receipts (approximately £470bn in 2012–13, implying that collection is an overhead of around 0.9%), estimates of tax avoidance and evasion (which could presumably be reduced with an increased HMRC budget), or against comparable figures for other countries.
Without providing this context, it is clearly impossible for users to work out whether a certain item provides value for money, or constitutes ‘wasteful’ spending.
Categorisation of data by socio-economic goal
The figures on GIST are split up by department, not by the overarching purpose, such as healthcare, justice, or science. The government’s internal budgeting is of less public (and policy) interest than the goals on which the money was spent.
This issue is particularly pertinent to R&D. For example, medical research is funded from a variety of sources: research councils such as BBSRC and MRC via BIS; the Department of Health; and through money allocated to universities via the Higher Education Funding Councils. Working out whether we invest enough in, for example, cancer research, is not currently possible using GIST.
Prominent use of annual, per capita figures
Millions or billions of pounds per quarter is not a scale on which most people are used to manipulating figures. The data should be available on an accessible and consistent scale to make comparison easier: we would recommend much more prominent use of per capita, annual figures. As well as converting figures to a scale that is easier to understand, this would also allow for meaningful comparisons between the UK and other countries.
Tools such as GIST have the potential to increase transparency and participation in the process of government. However, if this potential is to be realised, it is vitally important that the enormous, abstract spending figures are made relevant to members of the public in their everyday lives, in context, purpose and scale. We hope that you find our suggestions useful and that they might be implemented in a future release of GIST. If you have any further questions, please don’t hesitate to get in touch.
Finally, we have published this e-mail as an open letter on our website, at scienceogram.org/blog/2013/08/gist-public-spending-open-letter/, and we would like to publish any further correspondence there too. Please let us know if there will be a problem with this.
Yours faithfully,
Andrew Steele and Tom Fuller
Scienceogram UK
scienceogram.org