Response to the 2015 Science Budget inquiry
Summary
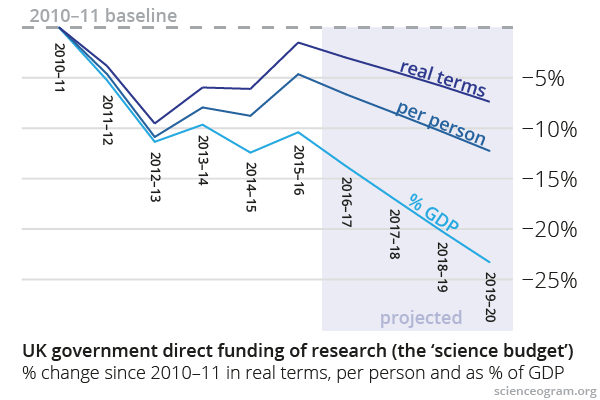
- There was a significant real-terms shortfall in the Science Budget in the last parliament. If current policy continues, the Science Budget in 2020 will have fallen by 5% in real terms, 12% per capita and 25% as a fraction of GDP compared to 2010.
- It is difficult to assess the complementarity of the core Science Budget and departmental research budgets as no statistics are available which enable a rigorous examination of the issue.
- The future trajectory of research investment should be informed by high-level cost–benefit analysis, and a transparent consultation process engaging with politicians, policymakers, scientists and the public.
- Government should gather appropriate data to act as the basis for this process: research funding data aggregated into a policy-relevant taxonomy should be considered together with a wide range of corresponding socioeconomic comparators.
- Results of research will directly reduce government spending on a range of programmes, from health research reducing costs to the NHS, to social sciences ensuring the most efficient deployment of services across government.
- This kind of analysis advocates strongly for increased investment in research.
Introduction
This evidence is submitted on behalf of Scienceogram, a campaign aiming to make sense of research spending in the UK and around the world. Scienceogram’s analysis puts public funding of research in context, examining investment in comparison to context-setting figures relating to the size of the socioeconomic challenges science can address, as well as the wider economy.
We set this out in a series of short, evidence-based articles and easy-to-understand infographics, all of which can be found along with source data on our website, scienceogram.org.
Scienceogram demonstrates a wide disparity between investment in research and its potential benefits, and in doing so outlines a collection of approaches to setting coherent levels of investment in science.
For example, cancer kills around 30% of people in the developed world, and yet we spend less than £3 per person per year on government-funded cancer research. Furthermore, cancer is arguably the best-funded medical condition—stroke is responsible for 10% of deaths, and yet just 70p per person per year is spent on research1. These kinds of comparisons make it clear that investment in even the best-funded conditions is disproportionately small compared to the socioeconomic context in which they sit.
As far as we are aware, no national government conducts this kind of high-level cost–benefit analysis when setting research budgets. Indeed, the UK Government doesn’t even conduct a centralised audit of research spending by subject area or socioeconomic goal. This makes evaluating—and indeed setting—current funding policy extremely problematic.
We believe that collection of data both on research funding itself and its wider socioeconomic context would be of huge value to government, and provide a basis for wider consultation and engagement on science funding policy. Presenting figures in this way is not only more relevant to policymaking, but also makes them accessible to other stakeholders including the general public.
Furthermore, given the insights we have encountered in gathering these statistics for Scienceogram, we believe that such data would advocate strongly for increased investment in research. Additional investment has great potential to improve our health, environment and economy. It can also reduce government spending in many areas, from improved medical treatments reducing NHS costs, to social sciences research improving the evidence basis for, and thereby efficiency of, government policy.
We elaborate on this philosophy, and its impact on the way research budgets should be allocated, in the remainder of this submission.
The Science Budget
The extent to which the current ring-fence arrangements, and the separate arrangements for determining ‘resource’ and ‘capital’ allocations, have produced coherent UK science and research investment.
For administrative and political purposes, most public funding of research and development (R&D) falls into two categories. The ‘Science Budget’, which itself is subdivided into resource and capital allocations, and individual government departments’ R&D into their respective policy areas. Whilst such divisions are essential for accounting purposes, they are clearly somewhat arbitrary from a policy perspective, and will not necessarily lead to a coherent strategy in terms of research funding.
The ringfencing of the science resource budget in 2010 froze spending in cash terms at £4.6bn per annum. This value has no particular policy significance, and the steady decline in this budget as a result of inflation since 2010 means that one potential rationale—continued support of a research ecosystem at a scale where it is known to be successful2—ceases to apply.
Furthermore, freezing the resource budget was accompanied by a dramatic cut in the capital allocation. Again, it is difficult to construct a policy rationale for this decision. Starting in the 2015–16 financial year, a capital settlement of £1.1bn per annum has been implemented. Much of this has been allocated by central government, though we appreciate that BIS conducted a wide-ranging consultation process to guide priority-setting, involving both major stakeholders and the public3.
In spite of this increase, the Science Budget overall has declined since the last government took power in 2010–11: there has been a drop of around 1.5% in real terms, and a 4.5% shortfall over the entire period.
This analysis ignores growth of the UK population and economy. Incorporating these is arguably highly relevant when examining government spending. In the case of science, the fruits of research are felt, and its costs shared, between everyone in the country, whilst a larger economy affords the potential for increased investment. Including these factors, the erosion of the Science Budget looks more dramatic: the 2015–16 budget is some 5% lower per capita, and over 10% lower as a fraction of GDP than it was five years previously.
If current policy continues, and assuming projected trends in the UK population and economy, the Science Budget in 2020 will have fallen by 5% in real terms, 12% per person and almost 25% as a fraction of GDP4.
There are also concerns that unless the increased capital budget is matched by an increase in resource spending, additional infrastructure cannot be used to greatest advantage for the UK. There are already many examples of existing facilities running below capacity for want of relatively small quantities of resource funding (e.g. the ISIS neutron and muon source in Oxfordshire only runs for 120 out of a potential 180 days per year due to a shortfall of just £3m per annum in running costs5). There is a significant risk that a continued mismatch between resource and capital investment could aggravate problems like these, as well as creating new ones.
In fact, it is unclear why there is a specified division between resource and capital spending at all. No evidence has been advanced for this, and the ratio between the two has varied erratically over the last five years.
Departmental research spending
The extent to which science and research expenditure in Government departments (outside the Science Budget) complements or competes with the Science Budget.
Just under half of UK public R&D funding is disbursed directly by Government departments. As well as contributing to the general advancement of knowledge across a range of socially and economically important areas, this research underpins evidence-based policymaking across government.
It is difficult to comment on the complementarity of these funds with the Science Budget, because there are no statistics available which enable a rigorous examination of the issue. The most relevant publicly available data are the SET Statistics6, but these can only give a limited overview from a policy perspective because they are only reported by departmental divisions.
One problem is that reporting spend by department leads to ambiguities when budgets are transferred between them. An illustrative example is the nearly 50% increase in the Department for Business, Innovation and Skills (BIS) R&D budget between 2010 and 2011. This largely resulted from the UK subscription to the European Space Agency being transferred to BIS. What is of interest to policymakers, politicians and the public is, for example, the overall UK investment in space research, and how this compares to the potential economic and social opportunities arising from it. Reporting research spend by department makes this difficult or impossible to ascertain, and there is therefore a strong case for both past spending and future strategy to be summarised thematically rather than by contemporary administrative divisions.
One table in the SET Statistics does attempt to divide spending into themes7, but there are large uncertainties resulting from the underlying methodology. Indeed, according to BIS, ‘these calculations are not very meaningful’ because the survey asks respondents to report how much of their expenditure ‘relates’ to specified categories, without requiring a thorough or consistent audit of spending8.
A thorough understanding of how departmental research and the Science Budget complement one-another requires significantly more detailed statistics than are available at present.
The future trajectory of investment in research and development
The need for and rationale for any adjustment to the trajectory of future Government expenditure on science and research, and what would be gained from an increase (or lost from a reduction) compared with current expenditure levels.
Scientific research and innovation are vital to the UK economy and environment, our health and our lifestyles. We believe that there is a strong case for setting an ambitious upward trajectory for funding across a variety of disciplines, motivated by high-level cost–benefit analyses.
The first challenge is aggregating funding into a policy-relevant taxonomy. Currently available science and technology spending data are usually divided up either according to internal governmental budgetary divisions (for example by research council or department), or by traditional subject area (such as physics, chemistry, biology, engineering, maths, social science, etc.). These bureaucratic divisions cannot provide a policy context within which to set the future trajectory of investment.
Instead, we recommend collecting data on R&D spending in cross-departmental, interdisciplinary thematic areas, such as socioeconomic goals. These goals could include health, energy, food, and so on. Such categorisation is arguably the best lens through which to view science and technology funding from both a public interest and a policy perspective. Further granularity within these categories (e.g. specific diseases within the health research portfolio) would be useful for more detailed comparisons.
These kinds of data are available from some sources outside government. They include figures from non-governmental bodies9, studies by academics and charities10, and international datasets such as those compiled by the UN and OECD11. However, as well as being sparse, these sources vary significantly in methodology, and cannot be used to obtain a coherent overall picture of UK research investment.
Thus, we recommend that the Government collate its own figures with universal coverage and a consistent methodology.
Having created a thematic summary of science spending, we recommend that the Government consider appropriate comparators from elsewhere in society and the economy to inform the trajectory for future funding. The best way to provide context varies by the type of research, and there may be multiple perspectives from which to view each one. For example, in the case of health, investment in disease-specific research can be compared to the fraction of deaths caused by those diseases (as mentioned in the Introduction), the burden of (disability-adjusted) years of life lost due to them, or their total economic cost. The choice of comparators inevitably has a subjective and political component, and judicious use of multiple comparisons allows conclusions to be robust and politically neutral.
Another perspective which can be used to put science funding into context is the historical and projected costs of achieving specific scientific goals. For example, a 2002 German government analysis estimated that developing nuclear fusion to the point of viable electricity generation would cost between €60 and €80 billion12. Such estimates are inherently uncertain, but are very inexpensive when appropriate comparisons are drawn. For example, this programme cost amounts to less than a third of the UK’s annual spending on energy13. It is also comparable to the cost of large public infrastructure projects (HS2, for example, is forecast to cost around £50bn14). For this comparatively small sum, developing nuclear fusion would have transformative implications for global energy production and climate change.
It is also important to consult experts to perform horizon-scanning when devising categories for analysis and setting priorities. For example, diseases such as cancer, cardiovascular diseases and dementia all primarily afflict older people. There is good evidence that these age-related conditions would together be susceptible to interventions which tackled their root cause, namely the process of ageing itself. Over 80% of deaths in the UK, and around 60% of deaths globally, result from ageing, and yet only a minute fraction of public investment in research goes into understanding and treating it. The vast socioeconomic cost of age-related frailty and disease makes a strong case for dramatically increased funding15. We suggest that priority be given to ageing research in exercises to optimise the UK research portfolio, and that it provides a convincing example of the importance of such horizon-scanning more broadly.
In spite of having considered a wide range of research endeavours, we have yet to encounter an area of science whose funding is other than a very small fraction of its potential benefits to society. This makes a strong prima facie case for increasing investment in many different kinds of research, and gathering and analysing data to ensure that such investment is made in the most effective possible way.
Finally, research funding strategy should be overseen at the highest strategic level with a transparent consultation process involving MPs, policymakers, the wider scientific community and the public, and we believe that such a consultation should be based around data like these. This process should be repeated periodically, to ensure continual scrutiny of the UK’s investment in research.
There is currently no mechanism for this kind of consultation. Current strategic goals, such as the Eight Great Technologies, have been set without an open and transparent process involving cost–benefit analysis, or any forum to engage a range of stakeholders. It would be very worthwhile for the Committee to investigate the creation of such a framework.
Whether the current distribution of the budget between particular types of expenditure…achieves an appropriate balance between pure and applied research.
It is worth emphasising the importance of pure research, conducted solely to improve our understanding of the natural world and with no particular social goal in mind. It is vital that neither existing funding mechanisms nor the auditing procedures suggested in this submission unintentionally discriminate against pure research.
Given the unknowability of future discoveries, it is important to recognise the limitations of cost–benefit analysis in science generally. These limitations are particularly acute with regards to pure research, and attempts to account for it are likely to underestimate the significance and diversity of potential applications. This point is underscored by the 7000 impact case studies produced for the 2014 Research Excellence Framework, many of which demonstrate the wealth and breadth of the societal benefits that can accrue from curiosity-led research16.
What level of Government expenditure on science and research is needed to optimally balance its benefits against the opportunity cost of Government expenditure foregone on other public services.
It is unhelpful to characterise investment in research as expenditure foregone in other areas. Science has consistently been shown to offer extremely competitive returns to both the economy and society. As is argued in a recent report commissioned by the Campaign for Science and Engineering, ‘science and innovation policy is not and should not be seen as a zero-sum game’17.
Research has found that the rate of return on UK public investment in cardiovascular disease and mental health research were 39% and 37%, respectively10, and a follow-up study investigating returns on UK cancer research found a comparable 40% return18. The Human Genome Project and subsequent genomics research is estimated to have returned $65 to the US economy for every $1 invested19.
Public-funded research has also been shown to have significant crowding-in effects on research conducted in other sectors. For example, a recent BIS analysis found that every £1 of public funding gives rise to private R&D funding amounting to between £1.13 and £1.6020.
Whilst these figures are not directly comparable, and acknowledging large methodological uncertainties in all of them, they are far in excess of typical returns on investment, such as long-run real-terms returns on UK equity of around 5%21. When the UK Government can raise debt at historically low levels, there is no need to forgo spending in other areas to make these highly profitable investments possible.
Some of the ways these economic benefits manifest will directly reduce government spending. For example, increased investment in health research will result in the development of more effective interventions for a variety of diseases. This will reduce health and social care costs to the state, as well as allowing patients and volunteer carers to remain economically active and thus contribute more to the tax system.
Medical treatment available through the NHS is regulated by cost–benefit analysis through the National Institute for Health and Care Excellence (NICE). NICE guidelines state that a treatment can be approved for use on the NHS if its benefits cost less than £20–30,000 per quality-adjusted life-year (QALY)22. Estimates of the cost per QALY gained through medical research by charities GiveWell and Giving What We Can find the cost per life-year to be $2800 and $8000 (£1800 and £5000), respectively23. Whilst these figures again inevitably come with large uncertainties attached, they fall comfortably within the threshold set by NICE. If funding of new treatments is ethically imperative at £30,000 per life-year saved, it follows that medical research is extremely cost-effective, and merits increased investment.
Further, much research by Government departments reduces the cost of public services directly. Evidence from social science regularly informs policymaking, ensuring that services are deployed in the most effective manner possible, maximising the benefits and reducing the cost to taxpayers.
Considering the wider context and impact of research is vital when setting the future trajectory for science funding, and the potential for significant savings to government and society should be factored in together with considerations of expenditure foregone.
The UK’s international competitiveness
The extent to which any increase or reduction in Government expenditure on science and research will have an impact on the UK’s relative position among competitor states.
During an oral evidence session for this inquiry, the Minister for Universities and Science told the Committee ‘it is important to focus on outputs principally rather than inputs’. However, the UK’s internationally enviable efficiency in terms of outputs cannot be sustained if investment in research continues to decline.
Firstly, it is obvious that decreased investment has the potential to cause widespread damage to a delicate, highly efficient institutional infrastructure. However, a significant factor in this efficiency is the UK’s historically strong reputation for academic science, and current attitudes to funding put this at risk.
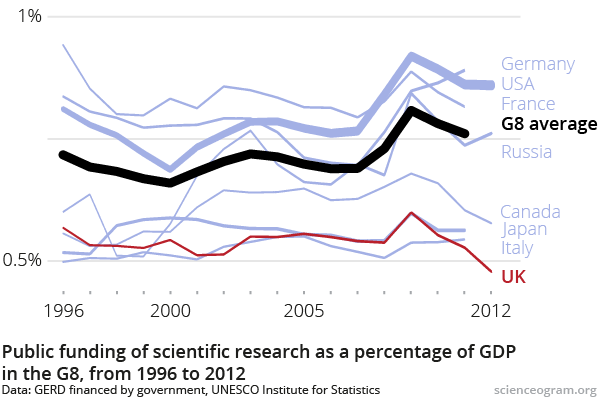
The UK currently invests less than 0.5% of GDP in public-funded R&D, less than any other G8 country in the last twenty years. The G8 average is around 0.8%, and economically and scientifically successful nations such as Germany and the US invest nearly 0.9% of GDP24.
This can create a perception of lack of commitment from the UK which discourages inward investment at all levels, from talented research scientists considering their careers to multinational companies contemplating locations in the UK. Even the continued threat of cuts can have significant reputational consequences.
This provides an argument from a different perspective for a strong Government commitment to increased public investment in science.
Authors and declaration of interests
Dr Andrew Steele is a computational biologist at the Francis Crick Institute. His work is funded by a fellowship from the institute. He has previously received grants from EPSRC and STFC. He is vice-chair of grassroots science funding campaign Science is Vital. He founded Scienceogram in 2013.
Minor alterations were made to this submission after an online consultation involving Scienceogram supporters and the wider community25.
- In depth: Health, Scienceogram http://scienceogram.org/in-depth/health/ ↩
-
UK Research base, Department for Business, Innovation and Skills, 2011 http://webarchive.nationalarchives.gov.uk/20121212135622/http://www.bis.gov.uk/policies/science/science-innovation-analysis/uk-research-base
The Scientific Century, The Royal Society, 2010 https://royalsociety.org/~/media/Royal_Society_Content/policy/publications/2010/4294970126.pdf ↩ -
Consultation on proposals for long-term capital investment in science and research, Department for Businnes, Innovation and Skills, 2014 http://bisgovuk.citizenspace.com/digital/consultation-on-proposals-for-long-term-capital-in
How should the government invest in science research? – live chat, Guardian, 2014 http://www.theguardian.com/science/occams-corner/2014/jun/10/how-should-government-invest-research-livechat ↩ - The declining Science Budget, 2010–2020, Scienceogram, 2015 http://scienceogram.org/blog/2015/07/science-budget-2020-spending-review/ ↩
- Isis laboratory funding shortfall ‘damaging UK’s research standing’, Guardian, 2011 http://www.theguardian.com/education/2011/nov/27/isis-neutron-source-funding-research ↩
- Science, Engineering and Technology Statistics, 2013, Office for National Statistics http://www.ons.gov.uk/ons/rel/rdit1/science–engineering-and-technology-statistics/2013/index.html ↩
- See Table 8: UK Government net expenditure on R&D by socio-economic objective, percentage share: 2007 to 2013. ↩
- BIS Ministerial Correspondence Unit, April 2013, correspondence reference 333251. ↩
- e.g. National Cancer Research Institute Cancer Research Database (CaRD) http://www.ncri.org.uk/what-we-do/research-database/ ↩
- e.g. Medical Research: What’s it worth?, Wellcome Trust, 2008 http://www.wellcome.ac.uk/About-us/Publications/Reports/Biomedical-science/WTX052113.htm ↩ ↩
-
Science, Technology and Innovation, UNESCO Institute for Statistics http://www.uis.unesco.org/ScienceTechnology/Pages/default.aspx
Main Science and Technology Indicators, OECD http://www.oecd.org/sti/msti.htm
RD&D Statistics, International Energy Agency http://www.iea.org/statistics/topics/rdd/ ↩ - Thermonuclear fusion: TAB report no. 075, 2002. http://www.tab-beim-bundestag.de/en/publications/reports/ab075.html ↩
- Energy price statistics, Department of Energy & Climate Change https://www.gov.uk/government/collections/energy-price-statistics ↩
- The Economic Case for HS2, House of Lords Economic Affairs Select Committee http://www.parliament.uk/business/committees/committees-a-z/lords-select/economic-affairs-committee/news/eac-hs2-press-release/ ↩
-
Ageing: Scientific Aspects, House of Lords Science and Technology Select Committee, 2005 http://www.publications.parliament.uk/pa/ld200506/ldselect/ldsctech/20/2002.htm
Pursuing the longevity dividend, S. Olshansky et al., Annals of the New York Academy of Sciences, 2007 http://onlinelibrary.wiley.com/doi/10.1196/annals.1396.050/abstract ↩ - REF Impact Case Studies, 2014 http://impact.ref.ac.uk/CaseStudies/search1.aspx ↩
- The economic significance of the UK science base, 2014 http://sciencecampaign.org.uk/UKScienceBase.pdf ↩
- Estimating the returns to UK publicly funded cancer-related research in terms of the net value of improved health outcomes, Glover et al., BMC Medicine, 2014 http://www.biomedcentral.com/1741-7015/12/99 ↩
- The impact of genomics on the US economy, Battelle, 2013 http://web.ornl.gov/sci/techresources/Human_Genome/publicat/2013BattelleReportImpact-of-Genomics-on-the-US-Economy.pdf ↩
- What is the relationship between public and private investment in science, research and innovation?, Department for Business, Innovation and Skills, 2015 https://www.gov.uk/government/publications/research-and-development-relationship-between-public-and-private-investment ↩
- Barclays Equity Gilt Study, Barclays research, 2014 https://wealth.barclays.com/en_gb/smartinvestor/better-investor/investing-lessons-from-114-years-of-data.html ↩
- NICE’s approach to economic analysis for public health interventions http://publications.nice.org.uk/how-nice-measures-value-for-money-in-relation-to-public-health-interventions-lgb10b/nices-approach-to-economic-analysis-for-public-health-interventions ↩
-
Returns to life sciences funding, GiveWell, 2014 http://blog.givewell.org/2014/01/15/returns-to-life-sciences-funding/
How valuable is medical research?, Giving What We Can, 2014 https://www.givingwhatwecan.org/blog/2014-08-27/how-valuable-medical-research ↩ - UK science funding drops below 0.5% of GDP, Scienceogram, 2015 http://scienceogram.org/blog/2015/03/uk-science-bottom-gdp-g8/ ↩
- Help Scienceogram write to Parliament, Scienceogram, 2015 http://scienceogram.org/blog/2015/08/science-technology-committee-parliament-submission/ ↩