Government departments slash research
The government has come under renewed pressure this week over its swingeing cuts to departmental research and development, shown by the Science, Engineering and Technology statistics released last year.
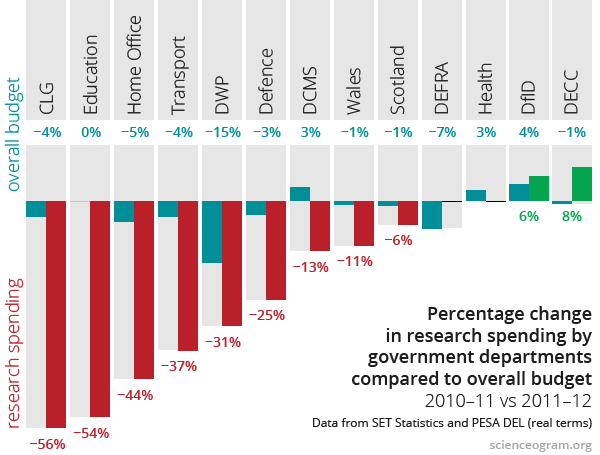
The cuts have been highlighted by articles in the Financial Times, Research Fortnight and a follow-up blog post from the Campaign for Science and Engineering (CaSE). Scienceogram produced the following graph, showing the disproportionate cuts to departmental R&D when compared to cuts to overall budgets in those departments.
‘It’s difficult to marry the Chancellor’s enthusiasm for science…with the severe pressure on departmental R&D both through budget cuts and consideration of the future of our national research institutes,’ CaSE Director Dr Sarah Main told Research Fortnight.
Freedom of Information requests by CaSE also showed that these cuts to R&D had occurred without any of the departments consulting the Treasury or the government chief scientist, contravening official guidelines.
We at Scienceogram also responded to the SET Statistics when they were released last year.
6 Comments
Autumn Statement 2014 continues the decline in science funding - Scienceogram UK
[…] also important to note that this graphic doesn’t consider research spending in other government departments, which has seen significant cuts—in some cases 50% in a single financial […]
UK science funding drops below 0.5% of GDP - Scienceogram UK
[…] This graph shows investment in research across the G8 since 1996, and is a stark illustration of the UK’s lacklustre international performance when it comes to investing in science. Having ranked near the bottom of the pack throughout, the decline since 2009 has taken the UK to unprecedented lows. This is the result of the steady erosion of the science budget by inflation after being frozen in cash terms in 2010, cuts in capital expenditure, and significant reductions in departmental spending on research. […]
UK investment in science drops below 0.5% of GDP | Science is Vital
[…] government’s imposition of a flat-cash settlement in 2010, cuts in capital expenditure, and significant reductions in departmental spending on research. Although Science is Vital welcomed the recent announcement of a commitment to a capital budget […]
Spending Review 2015: initial reaction - Scienceogram UK
[…] other huge unknown is what will happen to departmental funding of R&D, which is a significant contributor to UK research. In the aftermath of the 2010 Spending Review […]
New report highlights lack of data on research funding - Scienceogram UK
[…] have been some scandalous, disproportionate cuts in departmental research budgets. In 2011–12, the four worst offenders cut research by between 30% and 60% in a single financial year, whilst their overall budgets were […]
What would Brexit mean for UK science? - Scienceogram UK
[…] Budget which has fallen by every measure since 2010, and research in many government departments has also seen substantial reductions. Furthermore, science is just one of a string of areas which Vote Leave has suggested could be […]