New report highlights lack of data on research funding
Today marks the launch of the Missing Evidence report, the culmination of an inquiry by Sense about Science into evidence which underpins government policy. One of the significant problems which it highlights has also been a concern here at Scienceogram for some time: there isn’t any kind of centralised record government of research, ironically, means there’s a lack of evidence on which to base research policy.
Around half of public-funded research and development in the UK is funded by departments across government, from Education to International Development, to gather evidence to inform their policy decisions. For example, if the Department for Work and Pensions wants to know if a particular programme helps people back into work, it might commission some academics or consultants to oversee a pilot project and write a report.
This is vital for the good functioning of government, because what sounds good on paper or in Parliament may not work in practice, and we need good evidence on which to base difficult and complex decisions. However, as the Sense about Science report notes,
Although the Office for National Statistics’ Science, Engineering and Technology figures tell us that approximately £5bn is spent annually on government research, there is no reliable breakdown of what that money is spent on or what happens to the studies. Government does not collect this information centrally.
Not only do the Science, Engineering and Technology (SET) Statistics provide no breakdown, but they are several years out of date by the time they are published. The latest release, published in 2015, reports departmental spending on research as it was in 2013. This means those of us trying to scrutinise government research policy are always years behind the times, and in no position to critique or praise current plans.
Deciphering what’s really going on beneath the top-line figures can also be very tricky. For example, when the Department for Business, Innovation and Skills (BIS) took over the UK Space Agency’s budget in 2011, it looked like the BIS budget had increased, when really the money had simply been moved from elsewhere. It took some digging to find out that the important figure, our investment in space R&D, remained unchanged.
It’s also vital to keep an eye on the trajectory of research funding, and ask if we’re investing enough in rigorously checking whether government policy works. Research seems to be an easy target when trying to slim down departmental budgets: few will miss the Department for Transport’s drily entitled ‘Econometric analysis of long time-series rail passenger demand aggregates’ while there are potholes to be filled. (A topic on which, unlike research funding, the government has made data freely available, in an easily understood, interactive format.)
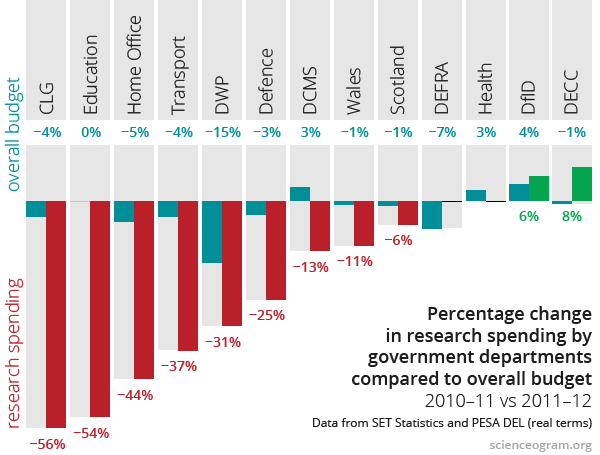
As we uncovered back in 2013, there have been some scandalous, disproportionate cuts in departmental research budgets. In 2011–12, the four worst offenders cut research by between 30% and 60% in a single financial year, whilst their overall budgets were squeezed by just a few percent. In the case of the Department for Education, the budget plummeted by 54% whilst the department experienced no overall funding cut. The graph from our blog post at the time is reproduced below.
Tracking down the facts on public-funded research is critical to holding the government to account. A thorough audit of what is spent by which departments is integral to this. The top recommendation made by the Sense about Science report is for ‘a standardised central register of all externally commissioned government research’. We couldn’t agree more.